Research Article 
 Creative Commons, CC-BY
Multiple Mean Comparison for Gene Expression Data via F -Type Tests under High Dimension with A Small Sample Size
*Corresponding author: Jiajuan Liang, Guangdong Provincial Key Laboratory of Interdisciplinary Research and Application for Data Science, BNUHKBU United International College, Zhuhai 519087, China.
Received: March 28, 2023; Published: April 11, 2023
DOI: 10.34297/AJBSR.2023.18.002478
Abstract
Multiplicity of data is very common in medical studies when experimental subjects are treated under different treatments. When there are multiple measurements on each subject and the number of subjects is limited, the multiple comparison among different treatments is facing with the problem of high dimension with small sample sizes, or even the total sample size across all treatments is less than the number of measurements. Traditional methods such as the multivariate analysis of variance for multiple mean comparison is going to lose power or becoming inapplicable when the total sample size is approaching to the data dimension. In this paper we propose to use Läuter’s F -type tests and Liang and Tang’s generalized F -tests for high- dimensional multiple mean comparison. Both of these two types of tests are always applicable regardless of the sample size being greater or smaller than the data dimension. The practical application of these two types of tests is illustrated by some real datasets consisting of gene expression data of multiplicity. The box plots of projected data on the principal component directions are recommended as a supplementary tool for a double check of validation of the tests.
Keywords: Analysis of variance; F -test; Gene expression data; Multiple mean comparison.
Introduction
Multiplicity of data, hypotheses, and data analysis is a common problem in biological and epidemiological studies [1]. It is also very common in many medical studies [2-5]. The classical ANOVA (analysis of variance) belongs to the area of multiple comparison. MANOVA (multivariate analysis of variance) can be considered as high-dimensional multiple mean comparison. It is a common practice to use ANOVA to test the significance of difference among different treatments on some experimental subjects. When there is only one observed variable from experimental subjects, ANOVA can be always carried out under the normal assumption on sample data with equal variances across experimental groups. When there are a large number of observed variables from each experimental subject, the traditional MANOVA requires the total number of experimental subjects must be greater than the number of variables, that is, n > p (n stands for the total sample size, p for the dimension of sample data). This condition, however, may not be satisfied in many medical studies. For example, in order to test the effect of a gene under different doses of some medication, the same dose can be repeatedly measured from a subject and the effect can be measured from different expressions. Each expression can be considered as a variable. Modern gene expression technology makes it possible to measure a large number of gene expression, but the number of experimental subjects are relatively limited to control experimental cost. This results in the situation of high-dimensional multiple mean comparison with a small sample size. The classical MANOVA method is no longer applicable for this kind of significance analysis on different treatments. Different methods have been proposed for multiple comparisons among treatment effects in the literature, see, for example, [6-9] among others. There are also many methods for analysis of gene expression data, see, for example, [10-13]. Most of these methods are more or less related to the methodology of multiple comparison.
In this paper, we will propose to use F -type tests for highdimensional multiple mean comparison with a small sample size. The methods were developed by La¨uter [14], La¨uter et al. [15] and Liang & Tang [16]. Section 2 gives an overview on the F -type tests. Section 3 demonstrates the application of the F -type tests using practical gene expression data. Some concluding remarks are given in the last section.
The F -Type Test for High-dimensional Normal Mean and Its Extension
Testing high-dimensional normal mean is to test the null hypothesis

versus alternative hypothesis 1 H : μ/ = 0 based on an i.i.d. (independently identically distributed) sample x1 , . . . , xn from a multivariate normal distribution N p (μ , Σ), , where Σ is unknown and assumed to be positively definite Np(Σ > 0) . The classical Hotelling T2 − test is equivalent to an exact F − test [17] and is based on the condition that the sample size n must be greater than the dimension p(i.e., n > p) so that the sample covariance matrix is nonsingular. Denote by

Data download
Reddits: Topics on the social networking site reddits contain content and comments on some topics(submissions) about abortion and gun control (Figure 1.1-Figure 1.2b).

where 1n stands for the n ×1 vector of ' 1 s and In for the n × n identity matrix. Define statistic

under the null hypothesis (1), LF in (3) has an exact F -distribution F(q,n − q) (Theorem 2 in [14]). Reject the null hypothesis (1) for a large value of LF
The above conclusion (3) was generalized to multiple normal mean comparison and a new typeo f generalized F −test was developed by Liang & Tang [16]. A multiple comparison of normal population means is to test the following hypothesis versus the alternative hypothesis H1: at least two means differ.

This is exactly the problem of classical multivariate analysis of variance (MANOVA) when assuming normal populations with an identical covariance matrix. Let {xij : i = 1, . . . , ni }be an i.i.d. sample from a normal population Np(μj,Σ) (j = 1, . . . ,K ) and assume that the k samples are independent with one another. We want to test hypothesis (4). It is well-known that hypothesis (4) is commonly tested by the classical Wilks-statistic [17].
Now we extend the LF −test (3) to testing hypothesis (4) and give a new F − type test. Let be the total observation matrix, where n= Σjk= 1nj . The extended LF −test and the new generalized
F − test are based on the following lemma (refer to Theorem 3 in Liang and Tang).

Lemma. Let the total observation matrix X be defined by (5) and A be a constant matrix defined by

Define the random matrix and the eigenvalue-eigenvector problem.

where D=(d1, . . . ,dq ) p × q q = min (n −1)- 1.D consists of q eigenvectors 1 { , . . . , } q d d associated with q positive eigenvalues of the non-negative definite matrix Y′Y ∧= diag (λ1,....,λq )consists of the eigenvalues 1 ... 0. q λ ≥ ≥ λ > Let

for testing hypothesis (4). Under hypothesis (4), GF has an approximate cumulative distribution function (c.d.f.) given by

where F(x;1, n − 2) represents the c.d.f. of the F-distribution F(1, n − 2) .
The approximate p-value of the GF -test (11) is computed by

where GF0 stands for an observed value of GF calculated from the observations { xji:i=1,...n;j= 1, . . . k, } and n is the total sample size given by (5). A large value of GF implies rejection of hypothesis (4).
It is pointed out that when the observation matrix X and the random matrix D in (2) are replaced by the random matrices Y and D in (8), La¨uter’s [14] result (3) is still true under the null hypothesis (4). The details are referred to Liang and Tang [16].
Application of the F -Type Tests for Grouped Gene Expression Data
In this section we will apply the F − test tests LF in (3) and the GF in (11) to several practical grouped gene expression datasets. A research project was carried out by Tianjin Medical University, China [17-19]. Rats were collected for experiment by four different treatments (doses) to see the treatment effects from 46 genes with sample size 6 ( , 1, 2, 3, 4) i n = rats i = for each treatment. In the experiment on 6 rats, the ratio of organ wet weight to body weight (organ coefficient) was observed. The purpose is to evaluate rats’ organ development during the treatment. Details on the experiment and medical analysis can be found in Gao et al. [19]. The rats were randomly put in four different groups. Each group was treated by four different doses of the same medication. The effects from the 46 genes were measured from each group and the gene expression data were obtained for each group. Cao et al. [20] carried out the significance test for each single gene using the same gene expression data and was able to identify the significant genes under the four different doses for each group. Now we want to test the overall significant difference for all 46 genes under the four different doses (treatments). That is, we want to test hypothesis (4) with k = 4, p = 46 , and the total sample size n = 4 × 6 = 24 (n < p) . The classical MANOVA is no longer applicable. We carry out the LF in (3) and the GF in (11) to get their p-values and simulate their empirical p-values by generating standard normal samples from (0, ) ( 46) p p N I p = because both LF −test and the GF − test are location-scale invariant under the null hypothesis (4). We select different q-values (q ≤ min(n −1, p) −1) :

where [·] stands for the integer part of a real number. The results are summarized in Table 1. The following observations can be summarized:
a. For the group “Male ARC data”, the LF −tests LF2 , LF3 , and LF4 show that a significance difference exists among the four treatments under the significance level α = 10% (their p- values are smaller than 10%), while the GF − test and the 1 LF − test fails to detect the difference among the four treatments (their p-values are greater than 10%);
b. For the group “Male MPN data”, the LF − tests LF1 and LF2 show that a significance difference exists among the four treatments under the significance level α = 10%. All other tests fail to detect the difference among the four treatments;
c. For the group “Male AVPV data”, all tests show that there is no significant difference among the four treatments;
d. For the group “Male Neonatal data”, all tests show that there is no significant difference among the four treatments.
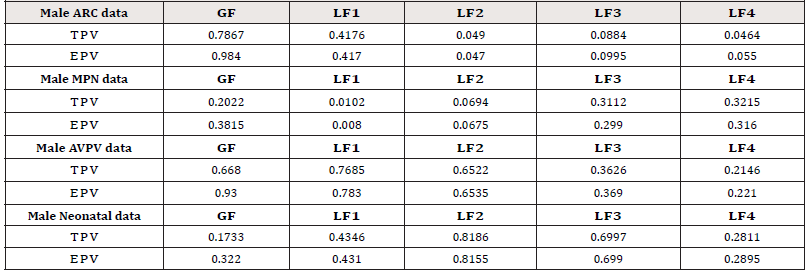
Table 1:p-values for multiple mean comparison among the four groups. (TPV= True p-value, EPV= Empirical p-value)
In order to identify the individual genes in each of the four
groups in Table 1, Cao et al. [20] applied the PCA-test (principal
component analysis test, Liang et al. [16]) to each single gene and
found the following genes show significant difference (level α =
10%) among the four treatments:
1) For the group “Male ARC data”, genes Esr1, Esr2, Ghrh,
Mtnr1b, and Npy show a significant difference among the four
treatments;
2) For the group “Male MPN data”, genes Ar, Avp,
Bdnf, Grin2a, Hcrtr2, Cyp19a1, and Tacr3 show a significant
difference among the four treatments;
3) For the group ‘Male AVPV data‘”, genes Crhr1, Crhr2, Gper,
Grin2b, Hcrtr2, Lepr, and Mtnr1b show a significant difference
among the four treatments;
4) For the group “Male Neonatal data”, genes Ar, Arntl,
Crhr2, Drd1a, Esr2, Hcrtr2, Cyp19a1, Mtnr1a, Per2, Slc17a6,
Tacr3, and Trh show a significant difference among the four
treatments.
Now we carry out the multiple mean comparison tests as in Table 1 on the overall significance of the single significant genes combined together in each of the four groups. The results are summarized in Table 2, where EPV (empirical p-value) for each test is not given because it is close to TPV (true p-value) as shown in Table 1. It shows that all five tests (GF, LF1 , LF2 , LF3 , LF4 ) successfully detect the significant group difference for individually significant genes in the two datasets “Male ARC data” and “Male MPN data” but fail to detect the significant group difference for individually significant genes in the two datasets “Male AVPV data” and “Male Neonatal data”. Further analysis is needed for these two datasets [21].
We also carry out the multiple mean comparison tests as in Table 1 on the overall significance of the single insignificant genes combined together in each of the four groups. The results are summarized in Table 3. It shows that all five tests give consistent results, which show that there is no significant group difference for the individually insignificant genes in all four datasets.
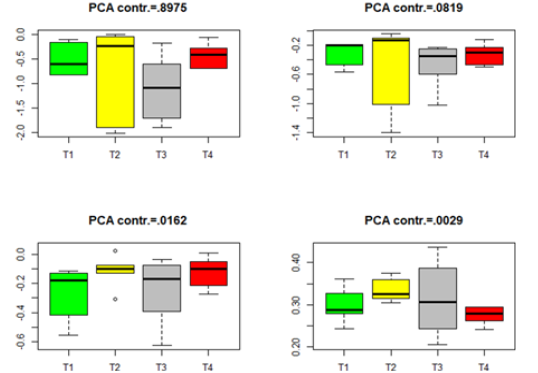
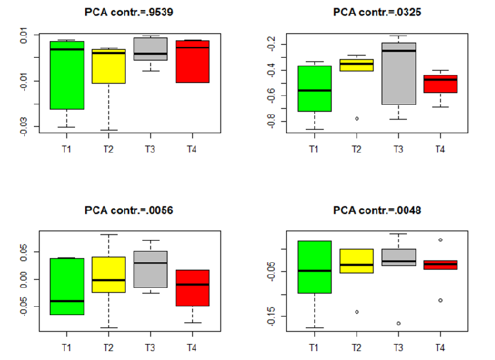
The p-values in Table 2 imply some inconsistent conclusions about the significant difference among the genes in the four treatments. Some further analysis can be carried out. We project the data from different treatments to the PCA directions determined by (8). For each dataset in Table 2, we project the data onto the first four PCA directions and point out the variation contribution of each PCA direction to the total variation, which is computed by Contribution of each PCA direction to the total variation =

where Λ= diag(λ1,....λq )is defined in (8). The Box plots for each of the four datasets in Table 2 are given in Figures 1-4. The projected data on the major PCA direction (with the largest contribution to the total variation) for each dataset shows that there exists substantial difference among the four treatments for the significant genes in each of the four datasets.
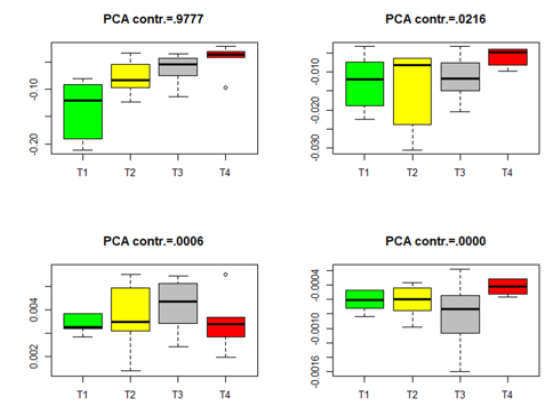
Figure 1:Box plots for the projected data for the significant genes in group Male-ARC. (T1-T4 stands for four different treatments).
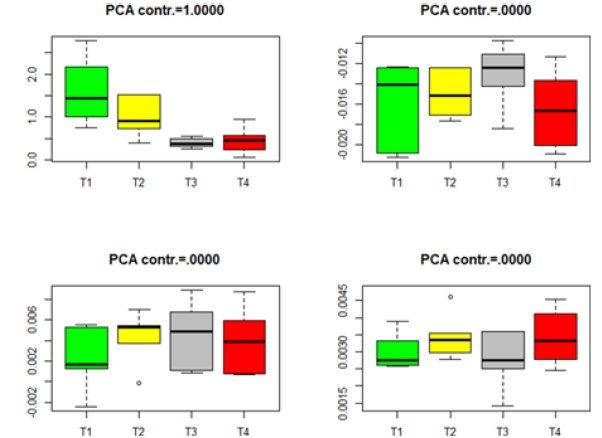
Figure 2:Box plots for the projected data for the significant genes in group Male-MPN. (T1-T4 stands for four different treatments).
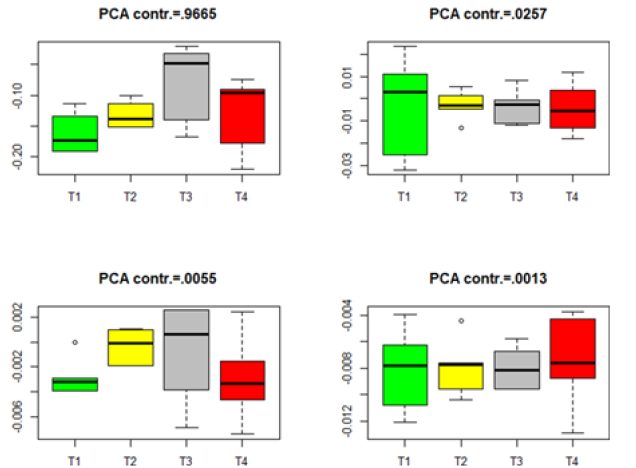
Figure 3:Box plots for the projected data for the significant genes in group Male-AVPV. (T1–T4 stands for four different treatments).
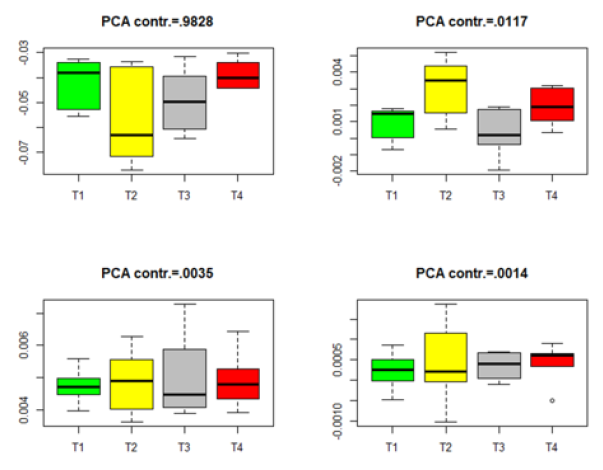
Figure 4:Box plots for the projected data for the significant genes in group Male-Neonatal. (T1–T4 stands for four different treatments).
Similar box plots for the insignificant genes in each of the four datasets in Table 3 are given in Figures 5-8. The projected data on the major directions (with larger contribution to the total variation) for each dataset shows that there is no significant difference among the four treatments for the insignificant genes in each of the four datasets. This is consistent with the numerical results (the p-values) in Table 3. The projected data on the major PCA directions (with larger contribution to the total variation) for each dataset shows that there is no substantial difference among the four treatments for the insignificant genes in each of the four datasets. This is consistent with the conclusions implied by the p-values in Table 3.
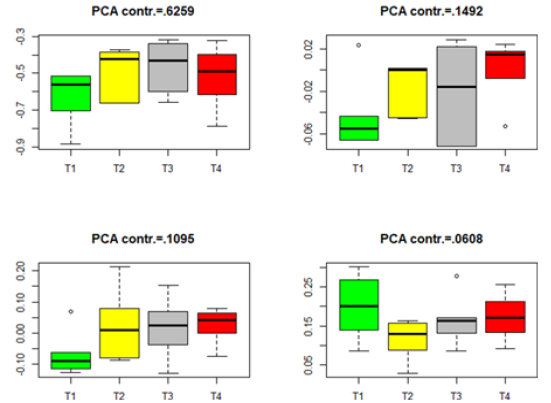
Figure 5:Box plots for the projected data for the insignificant genes in group Male-ARC. (T1–T4 stands for four different treatments).
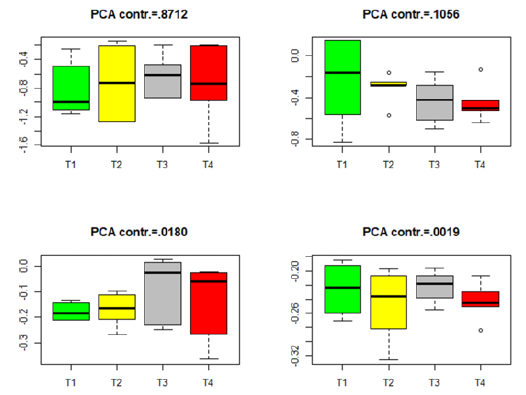
Figure 6:Box plots for the projected data for the insignificant genes in group Male-MPN. (T1–T4 stands for four different treatments).
Concluding Remarks
The F -type tests are easy to be applied to practical problems related to high-dimensional multiple mean comparison because of their easy numerical computation and the simplicity of their null distributions. They are all applicable to the cases of both large and small sample sizes, or even applicable to the case that the total sample size is smaller than the data dimension by choosing an appropriate number of PCA directions for dimension reduction. The La¨uter-type F -test (3) has an exact F -distribution under the null hypothesis (4) when there is no difference among the population means. But the choice for the number of PCA directions needs to be determined by data analysts in a somewhat uncertain way. The idea of variation contribution as illustrated in the real data analysis in Section 3 can be employed to determine the number of PCA directions q in the La¨uter-type F -test (3). For example, if the first q PCA directions already contribute more than 80% or 90%, one can choose the first q PCA directions for constructing the La¨uter-type F -test. Although the generalized F -test GF (11) does not have an accurate null F -distribution, its good approximation by the null distribution (12) was empirically studied by Liang and Tang [16] and it turns out to perform quite well for fairly small sample sizes. The GF -test attempts to capture the best data information from one of the PCA directions to see any significant difference among the population means after dimension reduction to a single direction. The LF -test attempts to capture data information from several PCA directions simultaneously to see any significant difference among the population means after dimension reduction to multiple directions. The real-data application in Section 3 also shows that both the GF -test and the La¨uter-type tests give consistent conclusions. This provides data analysts with some confidence in applying the proposed F -type tests to practical problems in the area of high-dimensional multiple mean comparison. Although there exist some possible weaknesses in applying the F -type tests in the sense that they may not give consistent results with those from graphical presentation of the projected data, as shown in Tables 1-3 & Figures 1-8, the different available tests associated with some graphical presentation of the projected data on the PCA directions in this paper shed some additional light to the methodologies for high-dimensional multiple comparison in many areas of data analysis with multiplicity.
Acknowledgement
This work was partially supported by a UIC New Faculty Startup Research Fund R72021106, and in part by the Guangdong Provincial Key Laboratory of Interdisciplinary Research and Application for Data Science, BNU-HKBU United International College (UIC), project code 2022B1212010006.
References
- Bender R, Lange S (2001) Adjusting for multiple testing–when and how? J Clin Epidemiol 54(4): 343-349.
- Hochberg Y, Tamhane AC (1987) Multiple comparison procedures. Wiley, New York, USA.
- Westfall PH, Young SS (1993) Resampling-based multiple testing. Wiley, New York, USA.
- Follmann D (1995) Multivariate tests for multiple endpoints in clinical trials. Statistics in Medicine 14(11): 1163-1175.
- Dudoit S, van der Laan MJ (2008) Multiple Testing Procedures with Applications to Genomics. Springer, New York, USA.
- Dunnett CW (1955) A multiple comparison procedure for comparing several treatments with a control. Stat Med 50: 1096-1121.
- Dunnett CW, Tamhane AC (1991) Step-down multiple tests for comparing treatments with a control in unbalanced one-way layouts. Stat Med 10(6): 939-947.
- Slonim DK (2002) From patterns to pathways: gene expression data analysis comes of age.
- Wolf FA, Angerer P, Theis FJ (2018) SCANPY: large-scale single-cell gene expression data analysis. Genome Biol 19(1): 15.
- Toronen P, Kolehmainen M, Wong G, Castren E (1999) Analysis of gene expression data using self-organizing maps. FEBS Lett 451(2): 142-146.
- Brown MP, Grundy WN, Lin D, Haussler D (2000) Knowledge-based analysis of microarray gene expression data by using support vector machines. Proc Natl Acad Sci USA 97(1): 262-267.
- Tusher VG, Tibshirani R, Chu G (2001) Significance analysis of microarrays applied to the ionizing radiation response. Proc Natl Acad Sci USA 98(9): 5116-5121.
- Parmigiani G, Garrett ES, Irizarry RA, Zeger SL (2003) The Analysis of Gene Expression Data: Methods and Software (Statistics for Biology and Health). Springer, USA.
- Lauter J (1996) Exact t and F tests for analyzing studies with multiple endpoints. Biometrics 52(3): 964-970.
- Lauter J, Glimm E, Kropf S (1998) Multivariate tests based on left-spherically distributed linear scores. The Annals of Statistics 26(5): 1972-1988.
- Liang J, Tang ML, Yang J, Zhao X (2020) An application of the theory of spherical distributions in multiple mean comparison. In: Fan J & Pan J (Eds). Contemporary Ex- perimental Design, Multivariate Analysis and Data Mining - Festschrift in Honour of Professor Kai-Tai Fang, Springer-Verlag, USA, pp. 189-199.
- Anderson TW (2003) An Introduction to Multivariate Statistical Analysis, (3rd Edition). John Wiley & Sons Inc. Publication, USA.
- Gao N, Hu R, Huang Y, Dao L, Zhang C, et al. (2018) Specific effects of prenatal DEHP exposure on neuroendocrine gene expression in the developing hypothalamus of male rats. Arch Toxicol 92: 501-512.
- Cao Y, Liang J, Gao N, Sun Z (2022) A new method for identifying significant genes from gene expression data. Biometrics and Biostatistics International Journal 11(4): 140-146.
- Sherlock G (2000) Analysis of large-scale gene expression data. Current Opinion in Immunology 12: 201-205.
Nature Genetics Supplement 32: 502-508.




 We use cookies to ensure you get the best experience on our website.